Assessing the all-important Gold-Silver Ratio
The Gold-Silver ratio is a key metric for evaluating the price of precious metals. It relates to the number of ounces of silver that it costs to buy an ounce of gold. When precious metals are cheap, the gold-silver ratio tends to be high. This means that those planning on investing in precious metals and their miners take a close look at this ratio. So let’s look at where we are right now, at the end of March 2018. Below is a graph, for the 50 years since 1968:
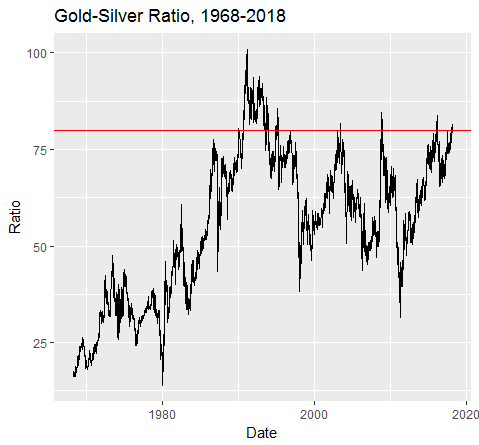
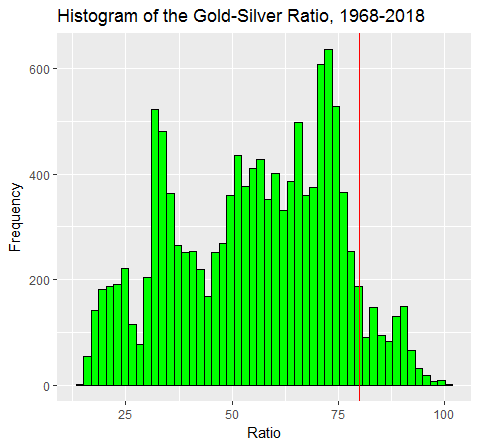
As you can see from the graph, since the early 1990s the gold-silver ratio has retreated every time it has gone over 80. And right now, it is over 80, which is moving into extreme territory. However one shouldn’t forget the early 1990s, when the ratio briefly went over 100. It happened before, it can happen again. To quantify the extremity, since 1968 the mean ratio has been around 55. The current value, of 81, is around the 93rd percentile, so it’s not off the scale. You can put this in a histogram:
Overall it does seem likely that something is going to happen with gold-silver ratio, very soon. Here’s a shorter term chart, from 2011 through to 2018:
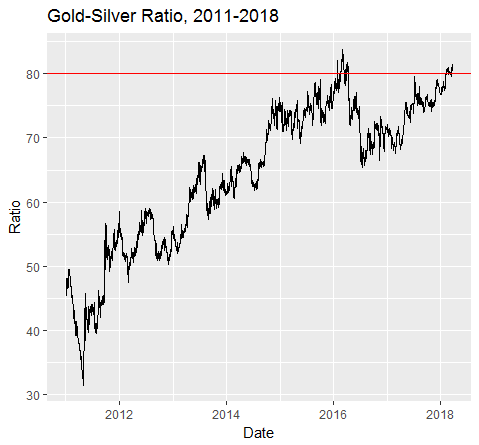
The gold-silver ratio has been rising since the beginning of 2011, with a short, sharp correction in 2016. The ratio is returning to the level it was at in early 2016, and if it can clear 84, then we might be returning to the 1990s highs. Which would of course be bad news for silver. On the other hand, we may be dealing with a double-top in the gold-silver ratio, which seems to me the most likely scenario. Indeed if you take 55 as a fair ratio, with gold at $1350, then you might expect silver to be nearer $25 an ounce than the $16.60 it is right now.